Know the Basics: Technical Analysis for Beginners
Technical Analysis is considered among the most referred-to types of market analyses out there as it can provide traders and investors with much-needed insights into the current and possible future prices of certain market assets.
As such, Technical Analysis is not only important for existing traders but can also be helpful for those who are new to trading in financial markets. Here are the basics of Technical analysis:

TL;DR:
- Technical Analysis examines historical price changes to predict possible future price movements.Traders, however, needs to be take note that historical performance may not be indicative of future results.
- Technical Analysis may help traders and investors estimate the value of their trades and plan their entry and exit strategy.
- Some of the basic Technical Analysis patterns include Head and Shoulders, Support and Resistance, Trendlines, Double Tops and Double Bottoms, Flags and Pennants.
- Traders can integrate risk management tools with Technical Analysis.
Introduction to Technical Analysis: What is Technical Analysis?
Technical Analysis is a trading strategy that looks into an asset’s price changes in order to get a better understanding of where the asset may be heading in the future. As such, any type of financial asset that has historical data can be examined through Technical Analysis.
Why Is Technical Analysis Important for Traders?
Technical Analysis can be important to traders who seek valuable information about an asset’s performance, strength, and price in relation to the market, how macroeconomic factors affect its performance, trading activity, and possible future outlook.
Popular Technical Analysis Indicators
Technical Analysis is multifaceted and uses multiple indicators to achieve its goal. Some of the most popular technical indicators include the following:
- On-Balance-Volume (OBV): This indicator helps determine the direction of an asset’s trading volume over time. As such, higher OBV shows a bullish market sentiment i.e., the buyers’ willingness to contribute to the rising price of a security, while lower OBV shows that selling volumes are higher than buying volumes. In other words, OBV serves as a validating indicator for an ongoing trend.
- The Moving Average Convergence Divergence (MACD): The MACD indicator reflects the direction of a trend, i.e. whether it’s bullish or bearish. Accordingly, when prices rise, the MACD level exceeds zero, hence reflecting a bullish trend. On the flip side, when the prices fall, the MACD level will be below zero which would suggest a bullish trend.
- Relative Strength Index (RSI): The primary purpose of RSI is to gauge the intensity of fluctuations in an asset's price. It achieves this by examining both the extent and pace of recent price variations in security, aiming to pinpoint situations of overvaluation or undervaluation. In other words, it is used to determine whether a security is overbought or oversold.
- Stochastic Oscillator: This indicator observes whether the price is reaching new highs during an uptrend or new lows in a downtrend and can be used to locate overbought or oversold situations. The way it does so is by assessing an asset’s present price in comparison to its range across a designated number of periods, graphing the outcome between 0 and 100. Due to the rarity of sustained highs or lows, the stochastic fluctuates rapidly.
- Moving Average (MA): The MA indicator helps locate market trends and provides a constant update of average prices. As such, a higher MA shows an uptrend while a lower MA shows a downward trend.
- Bollinger Bands: These Technical Analysis tool signals are used to measure volatility and identify potential price trends. They are also used to identify overbought or oversold market conditions.
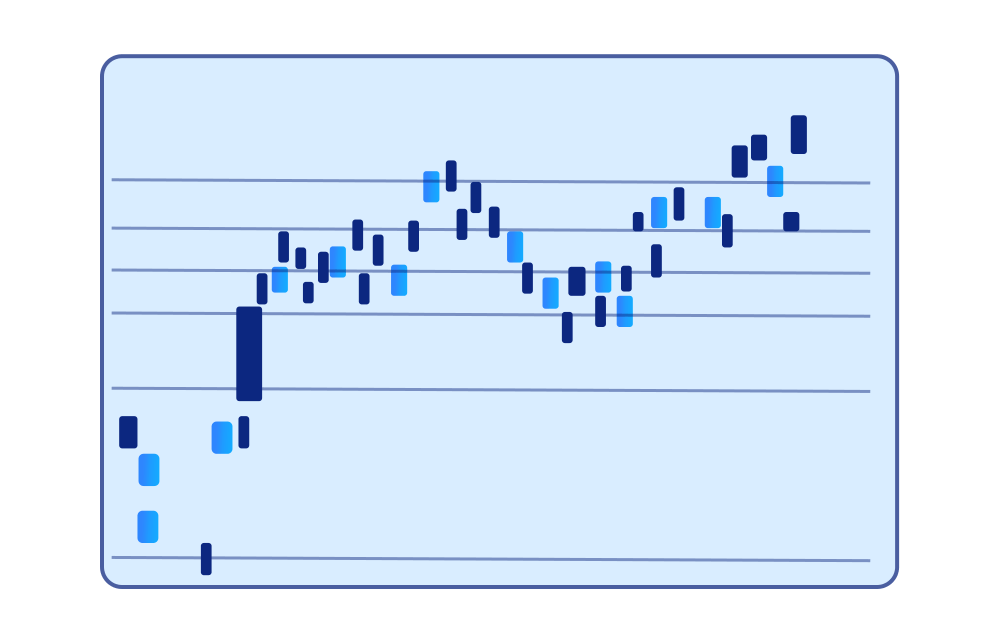
- Fibonacci Retracement: Fibonacci Retracement lines, depicted as horizontal lines on a price chart, signal potential support or resistance levels. These lines assist traders in pinpointing potential points of market reversal.
Other popular indicators include the Average Directional Index (ADX), Aroon Indicator, and Accumulation Line.
Understanding Chart Patterns
To get how Technical Analysis works, it is crucial to understand the different chart patterns as these can help you identify key price changes and get insights into possible future moves. Some of the most important chart patterns include Head and Shoulders, Trendlines, Support and Resistance, Flags and Pennants, and Double Tops and Double Bottoms.
Head and Shoulders
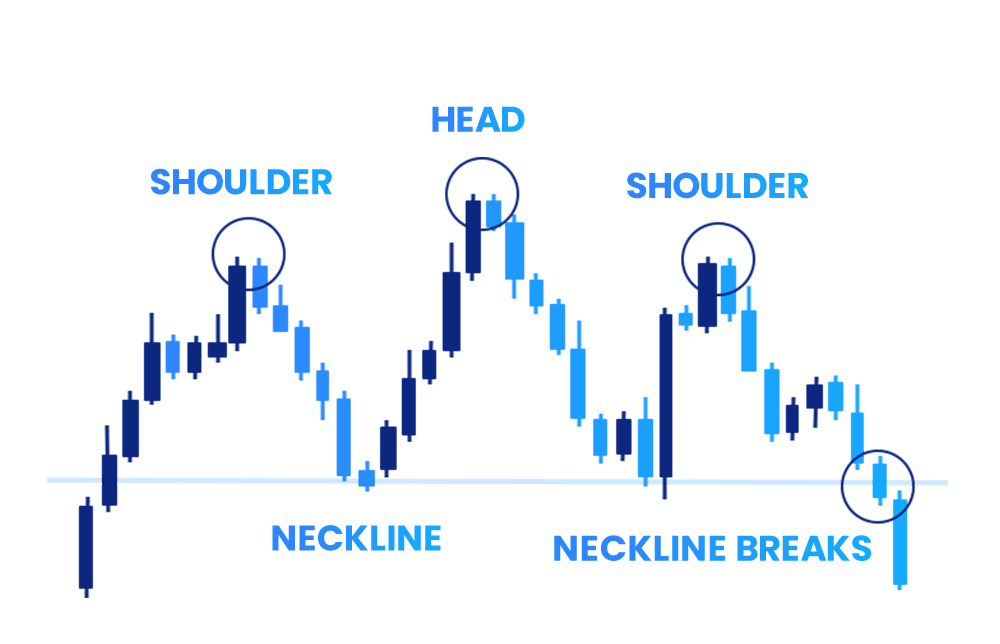
The head and shoulders chart pattern is used by traders to locate potential points for entering and exiting the market.
Visually, the pattern shows price drops or descents followed by an ensuing turnaround. The pattern comprises 3 points: the smaller ones are called "shoulders," while the central one is referred to as the "head." As such, a price decline beneath this neckline functions as an indication of a possible shift in the prevailing trend.
In other words, these points together resemble a head and shoulders illustration which is where the name is derived from.
Support and Resistance
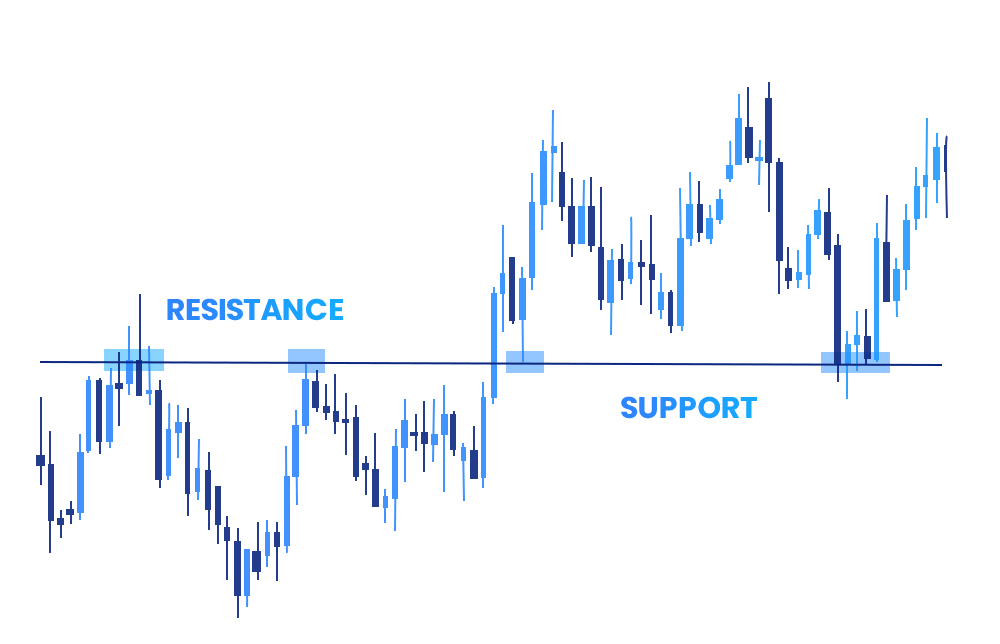
This helps technical analysts identify specific price levels on a chart which can indicate a probable interruption or reversal of an ongoing trend. The “support” level signifies the point where the price consistently stops its decline and rebounds, whereas the “resistance” level indicates where the price commonly halts its rise and retraces downward.
Support and Resistance levels can result from factors like supply and demand. For example, prices can increase when there are a lot of buyers for a certain financial instrument and can decrease when there are a lot of sellers.
Trendlines
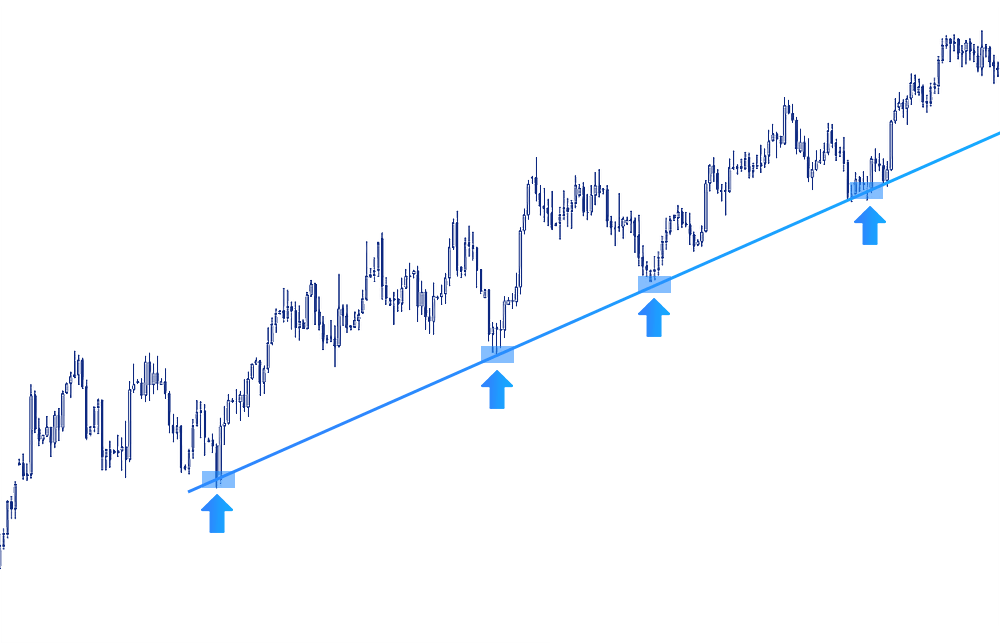
Trendlines are lines drawn by traders on a price chart in order to gain insights into the potential future direction of an instrument's prices. These lines are drawn by connecting price points, providing traders with a visual representation of price trends, velocity, and patterns during periods of contraction.
Traders also show Support and Resistance levels and, as such, are helpful for those seeking to locate trends or reversals of trends.
Double Tops and Double Bottoms
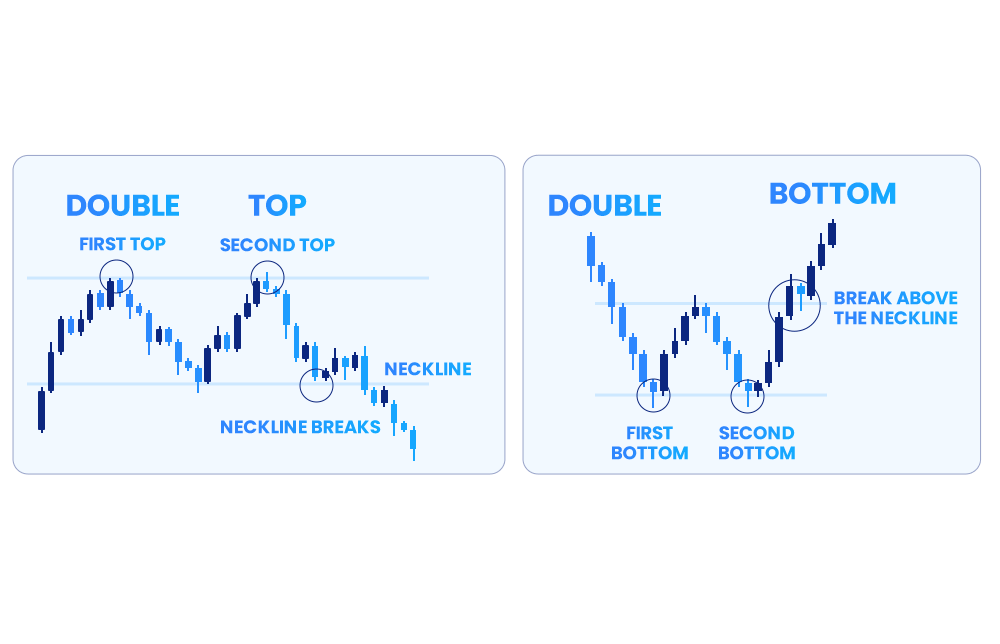
Perhaps one of the easiest ways to understand how Double Tops and Double Bottoms function, it may be helpful to remember that Double Tops refer to when prices move in the form of an “M” and reflect bearish trends, while Double Downs refer to price patterns that resemble the letter “W,” and reflect bullish trends.
These two price patterns are popular among Technical Analysis traders as they help to highlight shifts in the price of a security, alternative investment or trade. Moreover, these can be integrated into a trading strategy to capitalize on repetitive patterns.
To read such patterns, one needs to know that Double Tops have two peaks separated by a valley, representing a resistance level where the asset's price faces difficulty breaking through. The valley is known as the "neckline," and it can indicate price reversals when the instrument's price falls below it.
On the flip side, Double Bottoms are made of two sequential troughs forming a "W" shape on the chart with the first one highlighting the end of the previous trend, and the next one showing the bottom of the emerging trend. Accordingly, the highest point in the “W” shape (between the two throughs) can signal a possible upcoming uptrend.
Flags and Pennants
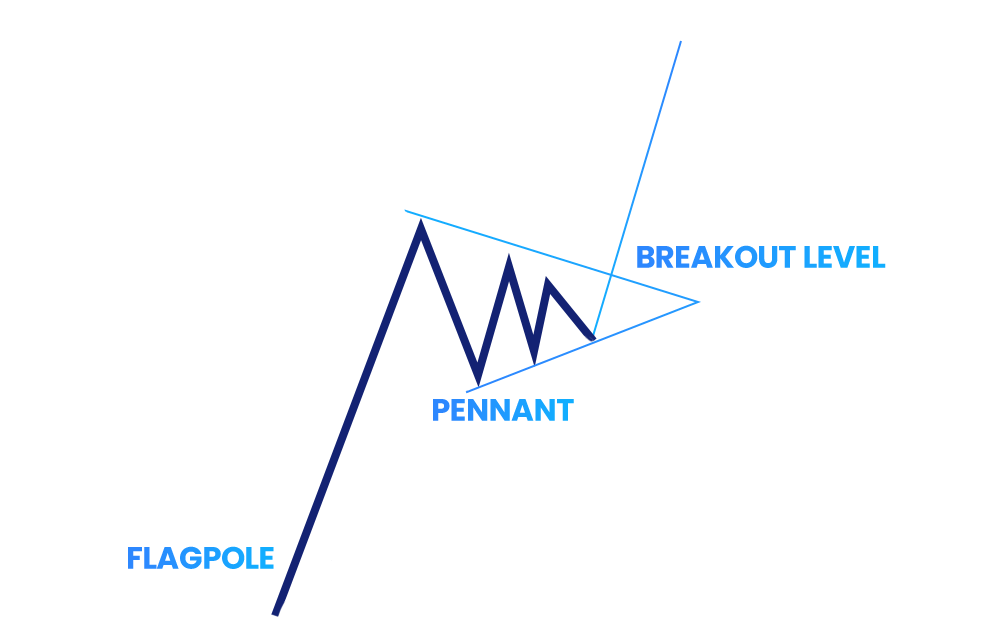
Flag and Pennant patterns can signal a brief consolidation before the previous price trend continues. As such, Flags are shown as sloping rectangles against the current trend, while Pennants appear as small triangles that result from price movements.
While these two patterns differ, both Pennants and Flags show short breaks in the market, and usually after these breaks, the initial trend will continue. Overall, traders use these patterns to find good times to enter the market, decide when to stop losses, and set goals for prices.
How to Use Technical Indicators
Technical Indicators can be used for multiple reasons and purposes the main ones being to identify entry and exit points in a trade and identify price trends and reversals.
Identifying Trends and Reversals
Technical indicators can be used to recognize market trends and potential reversals. Early recognition of these shifts is crucial for traders seeking to capitalize on evolving market dynamics.
Identifying Entry and Exit Points
Technical indicators help traders and investors know when to enter and exit a trade based on price patterns, movements, trends, and reversals.
Moreover, technical indicators can be used to develop trading strategies as well. You can learn more about the different types of trading strategies in our Trader’s Guide video on “Popular Trading Strategies”.
Risk Management in Technical Analysis
Using risk management strategies when conducting Technical Analysis is pivotal to your overall performance as a trader in general and as a Technical Analysis trader in particular.
As such, it is important to know the following risk management tools and techniques:
- Stop-Loss Order: This allows you to mitigate risk by stopping potential losses when trading.
- Position Sizing: This helps you limit your losses as you allocate a particular amount of money for a trade based on your risk tolerance.
- Profile Diversification: This helps you spread your risk among different markets hence lowering trading risk and potential losses.
Conclusion
In conclusion, Technical Analysis is a vital tool for both new and experienced traders alike, providing insights into current and future market prices.
Accordingly, understanding indicators like OBV, MACD, and RSI, and knowing how to read certain chart patterns such as head and shoulders or flags is crucial for informed decision-making, and identifying trends and reversals. In addition, integrating risk-management strategies into the Technical Analysis can increase the potential for reaching your desired trading outcomes.


